
Value stream map
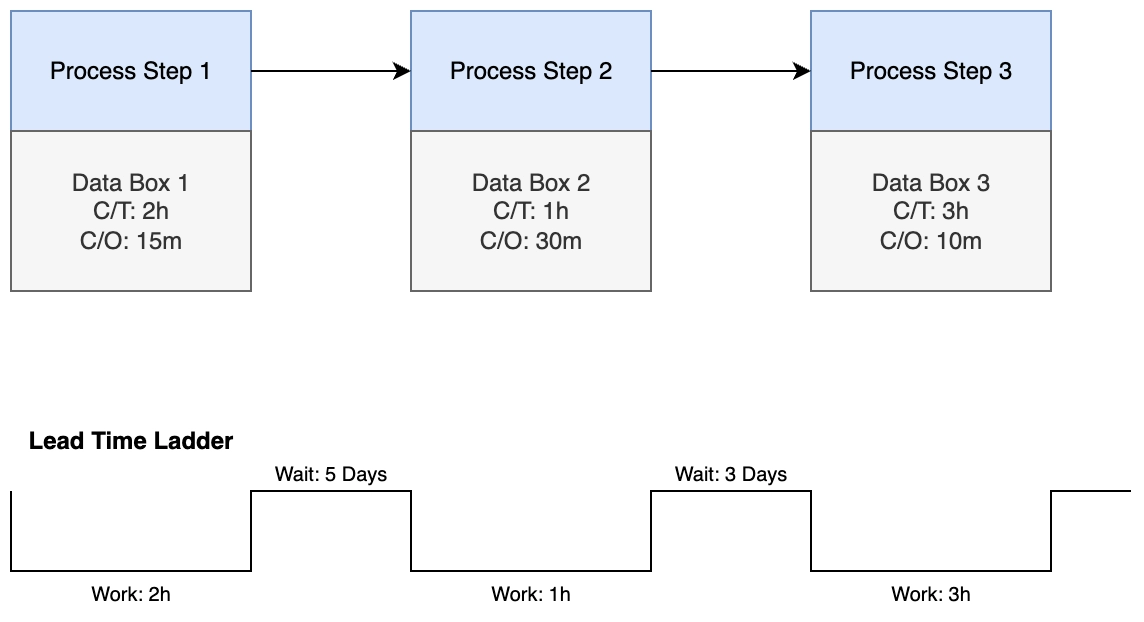
A value stream map is a lean tool: process boxes across the top, data boxes under each one, and a lead time ladder along the bottom that separates the time spent working from the time spent waiting.
The ladder is the point. Most value stream maps reveal that the work takes hours and the waiting takes weeks.
#When to reach for one
Improvement work, where you need evidence rather than opinion about the bottleneck.
Comparing current state and future state side by side.
Any process where people disagree about which step is slow.
#How to draw it in Capable
Route | Use when |
|---|---|
draw.io | The standard choice: the shapes and the ladder need precise placement. |
Excalidraw | A first pass in a workshop, before the numbers are real. |
#What goes in a data box
Metric | Why it matters |
|---|---|
Process time | How long the work itself takes |
Lead time | How long from arriving to leaving, including waiting |
% complete and accurate | How often the step's output is usable without rework |
#A few things that catch people out
Measure the waiting time, not just the processing time. Without it the map says nothing.
One map per product family. Averaging across different work hides the problem.
Draw current state before future state, even when everyone already knows the answer.
#Related
Draw the unhappy path too.























