
Subnet and VLAN diagram
Subnet documentation usually starts as a diagram and ends as a spreadsheet, because diagrams get unreadable at about the twentieth subnet. Text-generated diagrams push that limit a long way out.
Keep the allocation table and the diagram on the same page, and let each do what it is good at.
#When to reach for one
Documenting IP allocation so two teams do not claim the same range.
Planning a VLAN change with the current state visible.
Troubleshooting, where the question is which VLAN something is on.
#How to draw it in Capable
Route | Use when |
|---|---|
nwdiag | Networks as bands with addresses; generated, so it stays tidy. |
draw.io | Diagrams with firewall and routing detail alongside. |
#A worked example
VLANs as labelled network bands:
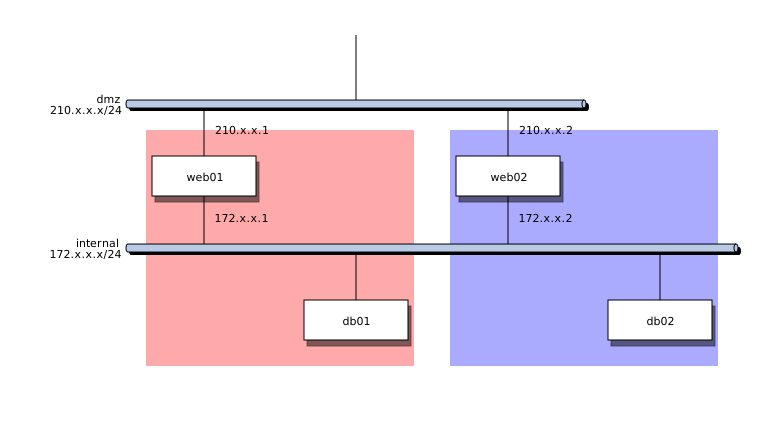
The source, which you can paste into a new diagram and edit:
#A few things that catch people out
Record the ranges you have reserved but not used. That is where collisions come from.
One diagram per site. A multi-site subnet diagram becomes a wall of numbers.
Keep the diagram beside the change process, so it is updated when the change is made.
#Related
Somebody will read this at 3am. Be kind.























