
State diagram (GraphViz)
Graphviz draws state machines well, particularly large ones, because the layout engine handles the placement you would otherwise do by hand.
#What this example shows
doublecircle for accepting states, a point for the initial one.
rankdir=LR, which is how state machines usually read.
Self-loops, drawn automatically.
#A worked example
Open it, edit it, or copy the source below.
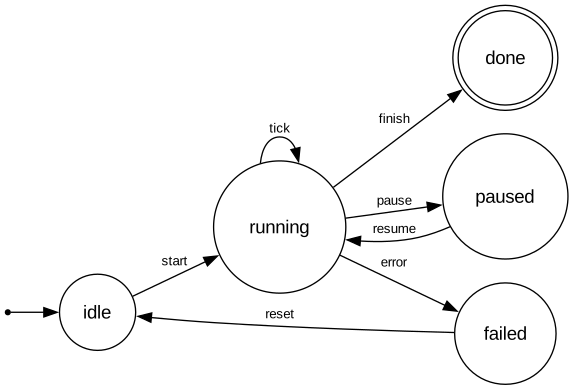
The source, which you can paste into a new diagram and edit:
#Making it your own
rankdir=LR reads better for state machines than the default top-down.
A point-shaped node is the conventional initial state marker.
Label transitions with the event, not the destination state.
#Related
Give it the edges. It does the rest.























