
Sankey diagram (Mermaid)
A Sankey diagram encodes quantity in the width of each flow, which makes it very good at showing where things go missing. Naming the loss paths is the whole technique.
#What this example shows
Source, target and value on each line, in plain CSV.
Loss paths named explicitly rather than left as a missing arrow.
Flows that balance, so what leaves a node matches what entered it.
#A worked example
Open it, edit it, or copy the source below.
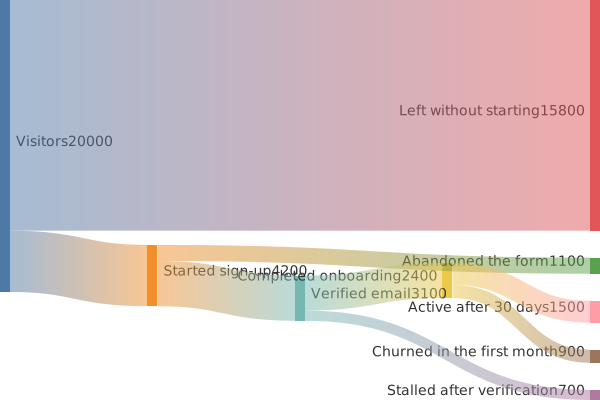
The source, which you can paste into a new diagram and edit:
#Making it your own
Flows must balance. If more leaves a node than entered, the diagram is wrong.
Name the loss paths. "Abandoned the form" tells you more than a missing arrow.
Keep the node count small; Sankey diagrams get illegible quickly.
#Related
Copy it. Change one line. See what happens.























