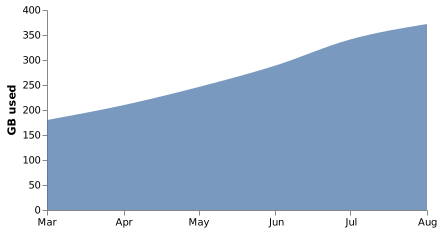
Area chart (Vega)
An area chart is a line with the region beneath it filled. In Vega that is a mark type and a time scale.
#What this example shows
A time scale, driven by parsed dates.
An area mark with y2 pinned to zero.
Interpolation, which controls the curve.
#A worked example
Open it, edit it, or copy the source below.
The source, which you can paste into a new diagram and edit:
{
  "$schema": "https://vega.github.io/schema/vega/v5.json",
  "width": 380,
  "height": 200,
  "padding": 5,
  "data": [{
    "name": "table",
    "values": [
      {"month": "2026-03-01", "gb": 180},
      {"month": "2026-04-01", "gb": 210},
      {"month": "2026-05-01", "gb": 246},
      {"month": "2026-06-01", "gb": 289},
      {"month": "2026-07-01", "gb": 341},
      {"month": "2026-08-01", "gb": 372}
    ],
    "format": {"parse": {"month": "date"}}
  }],
  "scales": [
    {"name": "x", "type": "time", "domain": {"data": "table", "field": "month"}, "range": "width"},
    {"name": "y", "type": "linear", "domain": {"data": "table", "field": "gb"}, "range": "height", "nice": true, "zero": true}
  ],
  "axes": [
    {"orient": "bottom", "scale": "x", "format": "%b"},
    {"orient": "left", "scale": "y", "title": "GB used"}
  ],
  "marks": [{
    "type": "area",
    "from": {"data": "table"},
    "encode": {
      "enter": {
        "x": {"scale": "x", "field": "month"},
        "y": {"scale": "y", "field": "gb"},
        "y2": {"scale": "y", "value": 0},
        "fill": {"value": "#4c78a8"},
        "fillOpacity": {"value": 0.75},
        "interpolate": {"value": "monotone"}
      }
    }
  }]
}
#Making it your own
Dates need format.parse or they are treated as strings.
zero: true keeps the baseline honest, which matters for filled areas.
interpolate monotone smooths without inventing peaks the way basis does.
All the control, all the ceremony.