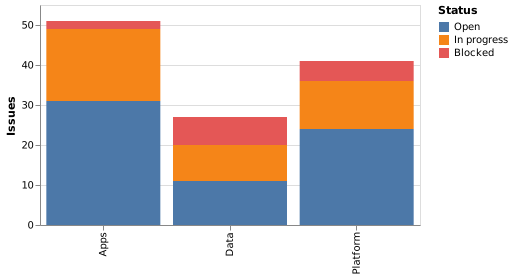
Stacked bar (Vega-Lite)
Stacking in Vega-Lite is automatic: add a colour channel to a bar chart and it stacks. Setting stack to normalize turns it into proportions.
#What this example shows
Automatic stacking from the colour channel.
A deliberate sort order on the series.
The one-line change that makes it a proportional chart.
#A worked example
Open it, edit it, or copy the source below.
The source, which you can paste into a new diagram and edit:
{
  "$schema": "https://vega.github.io/schema/vega-lite/v5.json",
  "description": "Open issues by team and status",
  "width": 380,
  "height": 220,
  "data": {"values": [
    {"team": "Platform", "status": "Open", "count": 24},
    {"team": "Platform", "status": "In progress", "count": 12},
    {"team": "Platform", "status": "Blocked", "count": 5},
    {"team": "Apps", "status": "Open", "count": 31},
    {"team": "Apps", "status": "In progress", "count": 18},
    {"team": "Apps", "status": "Blocked", "count": 2},
    {"team": "Data", "status": "Open", "count": 11},
    {"team": "Data", "status": "In progress", "count": 9},
    {"team": "Data", "status": "Blocked", "count": 7}
  ]},
  "mark": "bar",
  "encoding": {
    "x": {"field": "team", "type": "nominal", "title": null},
    "y": {"field": "count", "type": "quantitative", "title": "Issues", "stack": "zero"},
    "color": {
      "field": "status", "type": "nominal", "title": "Status",
      "sort": ["Open", "In progress", "Blocked"]
    }
  }
}
#Making it your own
Change stack to "normalize" for proportions instead of totals.
Sort the colour field explicitly, or the stack order is arbitrary.
Only the bottom segment is easy to compare across bars.
A real chart in about ten lines.