
Gantt diagram (Mermaid)
A Gantt chart is only worth drawing when it has dependencies. This one uses after to chain tasks, marks the critical work, and puts a zero-length milestone at the cutover.
#What this example shows
after, which makes a task start when another finishes.
crit, done and active, which mark status without a separate legend.
A milestone, which is a task with zero duration.
#A worked example
Open it, edit it, or copy the source below.
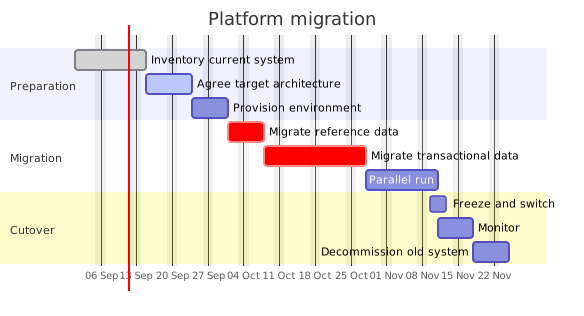
The source, which you can paste into a new diagram and edit:
#Making it your own
excludes weekends keeps the dates honest for work that does not happen at weekends.
Mark the critical path with crit, or every bar looks equally important.
Keep it coarse. Sixty rows is a project plan nobody will read.
#Related
Copy it. Change one line. See what happens.























