
UML timing diagram
A timing diagram plots how a participant's state changes over time. It is the UML equivalent of a hardware waveform, and it suits protocols where duration and ordering both matter.
Rare, and exactly right on the occasions it applies.
#When to draw one
Protocols with timing constraints or timeouts.
Explaining a race condition.
Documenting how long a participant stays in each state.
#What is on the diagram
Element | Meaning |
|---|---|
Lifeline | One participant, with its states stacked vertically |
State change | A step in the line at the moment it changes |
Time axis | Horizontal, with real units |
Constraint | A duration annotation between two points |
#A worked example
Two participants, their states, and a timeout:
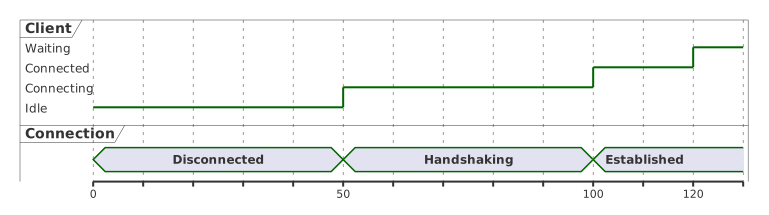
The source, which you can paste into a new diagram and edit:
#A few things that catch people out
Use real time units on the axis. A timing diagram with no units is a state diagram drawn sideways.
Annotate the constraints; the durations are the reason to draw one.
robust shows discrete states, concise shows a compact single line. Mix them deliberately.
#Related
Four types cover most of it.























