
Activity diagram (PlantUML)
The activity diagram is where PlantUML clearly beats a plain flowchart: real forks and joins for parallel work, and swimlanes that do not need drawing by hand.
#What this example shows
fork and end fork, for work that happens in parallel.
Swimlanes written as |Name| markers.
A repeat loop, for retry behaviour.
#A worked example
Open it, edit it, or copy the source below.
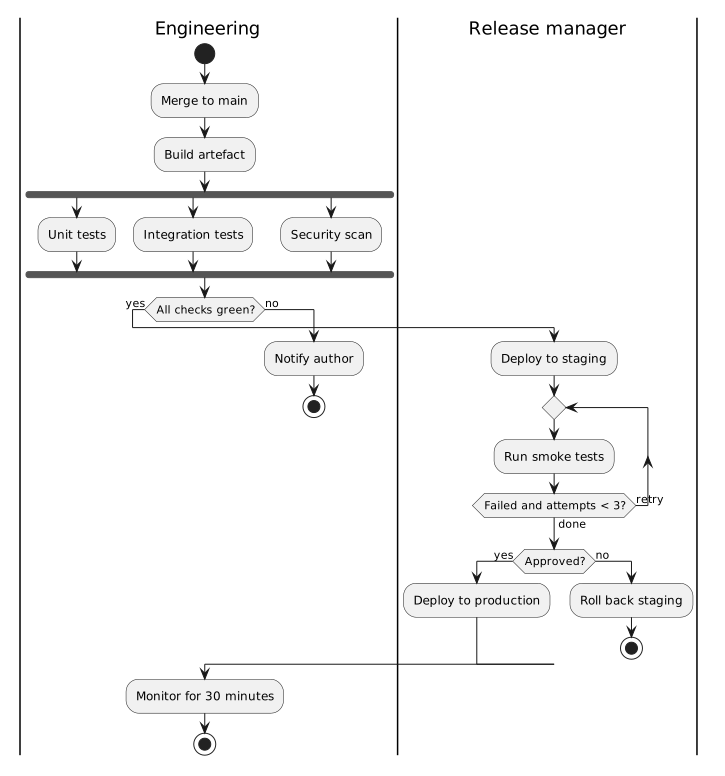
The source, which you can paste into a new diagram and edit:
#Making it your own
A fork must be closed by end fork; unclosed parallel paths are a modelling error.
Swimlane markers can appear anywhere; the next activity lands in that lane.
Use repeat and repeat while for retries rather than drawing a loop by hand.
#Related
Verbose, stable, and it draws almost everything.























