
Digital timing diagram
Timing diagrams show signals against time: clock edges, when a bus is valid, and what changes in response to what. WaveDrom generates them from a compact JSON description.
It is the clearest way to document a protocol where the answer to every question is "it depends when".
#When to reach for one
Hardware and firmware interface documentation.
Protocol specifications where setup and hold times matter.
Debugging notes: what you expected against what the analyser showed.
#How to draw it in Capable
Route | Use when |
|---|---|
WaveDrom | Purpose-built; clocks, buses, gaps and arrows. |
draw.io | Teaching diagrams where you want heavy annotation. |
#A worked example
An SPI-style transfer with a clock, chip select and data:
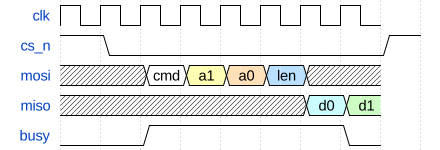
The source, which you can paste into a new diagram and edit:
#A few things that catch people out
Show the clock, even when the point is the data. Everything is measured against it.
Mark don't-care periods as x rather than leaving them flat; flat implies a value.
Annotate setup and hold requirements if the diagram is a specification rather than a trace.
#Related
Approximately right is wrong here.























