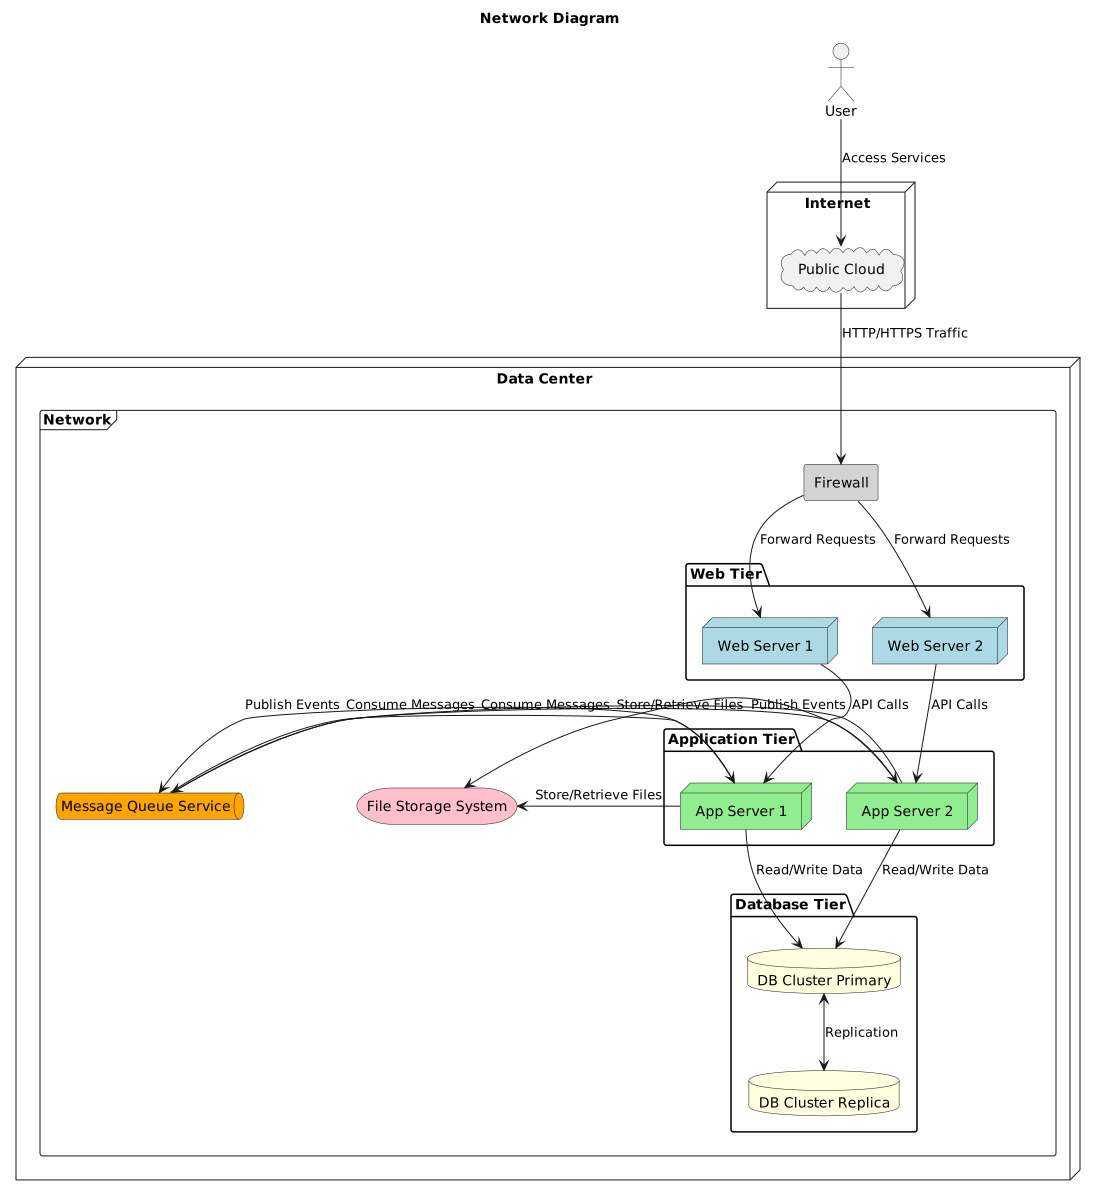
Network diagram (PlantUML)
PlantUML embeds the nwdiag syntax, so a network diagram with addressed bands can be drawn without switching languages.
#What this example shows
Networks as labelled bands with address ranges.
A host on two networks, joined automatically.
Descriptions on both networks and hosts.
#A worked example
Open it, edit it, or copy the source below.
The source, which you can paste into a new diagram and edit:
@startuml
title Network Diagram

actor User

node "Internet" {
  cloud "Public Cloud" as Cloud
}

node "Data Center" {
  frame "Network" {
    rectangle "Firewall" as FW #LightGray

    package "Web Tier" {
      node "Web Server 1" as WS1 #LightBlue
      node "Web Server 2" as WS2 #LightBlue
    }

    package "Application Tier" {
      node "App Server 1" as AS1 #LightGreen
      node "App Server 2" as AS2 #LightGreen
    }

    package "Database Tier" {
      database "DB Cluster Primary" as DBP #LightYellow
      database "DB Cluster Replica" as DBR #LightYellow
    }

    queue "Message Queue Service" as MQS #Orange

    storage "File Storage System" as FSS #Pink
  }
}

User --> Cloud : Access Services

Cloud --> FW : HTTP/HTTPS Traffic

FW --> WS1 : Forward Requests
FW --> WS2 : Forward Requests

WS1 --> AS1 : API Calls
WS2 --> AS2 : API Calls

AS1 --> DBP : Read/Write Data
AS2 --> DBP : Read/Write Data

DBP <--> DBR : Replication

AS1 -> MQS: Publish Events
AS2 -> MQS: Publish Events

MQS -> AS1: Consume Messages
MQS -> AS2: Consume Messages

AS1 -> FSS: Store/Retrieve Files
AS2 -> FSS: Store/Retrieve Files

@enduml
#Making it your own
Repeat a host in each network it belongs to; the layout joins them for you.
Addresses are free text, so check them against your allocation table.
Above thirty hosts, split the diagram by site or tier.
Verbose, stable, and it draws almost everything.