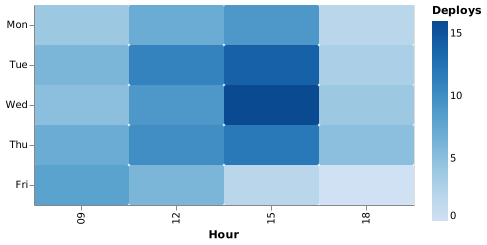
A heat map is a rect mark with two ordinal encodings and a quantitative colour. The colour scheme is the part that decides whether it is readable.
Open it, edit it, or copy the source below.
{
  "$schema": "https://vega.github.io/schema/vega-lite/v5.json",
  "description": "Deployments by weekday and hour",
  "width": 380,
  "height": 200,
  "data": {"values": [
    {"day": "Mon", "hour": "09", "n": 4}, {"day": "Mon", "hour": "12", "n": 7}, {"day": "Mon", "hour": "15", "n": 9}, {"day": "Mon", "hour": "18", "n": 2},
    {"day": "Tue", "hour": "09", "n": 6}, {"day": "Tue", "hour": "12", "n": 11}, {"day": "Tue", "hour": "15", "n": 14}, {"day": "Tue", "hour": "18", "n": 3},
    {"day": "Wed", "hour": "09", "n": 5}, {"day": "Wed", "hour": "12", "n": 9}, {"day": "Wed", "hour": "15", "n": 16}, {"day": "Wed", "hour": "18", "n": 4},
    {"day": "Thu", "hour": "09", "n": 7}, {"day": "Thu", "hour": "12", "n": 10}, {"day": "Thu", "hour": "15", "n": 12}, {"day": "Thu", "hour": "18", "n": 5},
    {"day": "Fri", "hour": "09", "n": 8}, {"day": "Fri", "hour": "12", "n": 6}, {"day": "Fri", "hour": "15", "n": 2}, {"day": "Fri", "hour": "18", "n": 0}
  ]},
  "mark": {"type": "rect", "cornerRadius": 2},
  "encoding": {
    "x": {"field": "hour", "type": "ordinal", "title": "Hour"},
    "y": {"field": "day", "type": "ordinal", "title": null, "sort": ["Mon", "Tue", "Wed", "Thu", "Fri"]},
    "color": {"field": "n", "type": "quantitative", "title": "Deploys", "scale": {"scheme": "blues"}},
    "tooltip": [{"field": "day"}, {"field": "hour"}, {"field": "n"}]
  }
}