
NWDiag
NWDiag draws network diagrams as horizontal bands, one per network, with nodes attached to each. A node on two networks appears on both bands automatically.
That single behaviour is why it beats hand-drawing for anything with more than two subnets.
#What it is good at
Subnet and VLAN documentation with addresses.
Small to medium network topologies that change.
Documentation generated from an IP allocation table.
#What it draws
Element | Syntax |
|---|---|
Network | network dmz { ... } |
Address range | address = "10.0.1.0/24"; |
Node address | web01 [address = "10.0.1.11"]; |
Description | description = "Public tier"; |
Groups | group { web01; web02; } |
#A worked example
Three networks with a host on two of them:
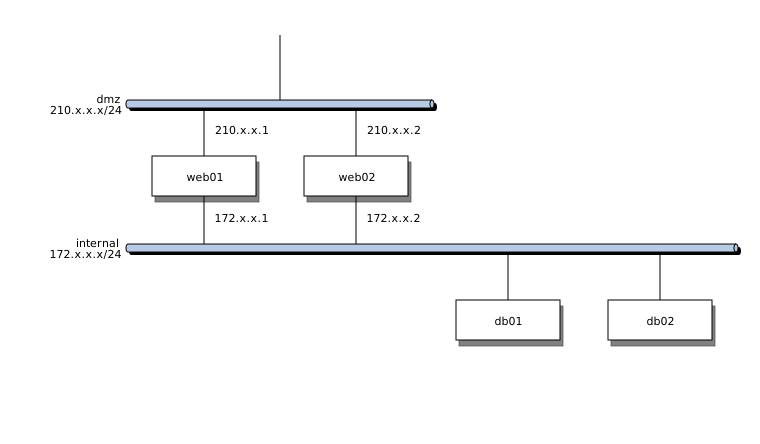
The source, which you can paste into a new diagram and edit:
#A few things that catch people out
Repeat the node name in each network it belongs to; NWDiag joins them for you.
Addresses are free text, so a typo renders happily. Check them against your allocation table.
Above roughly thirty nodes it gets tall. Split by site or tier.
#Related
Thirty-one languages. Nobody knows them all.























