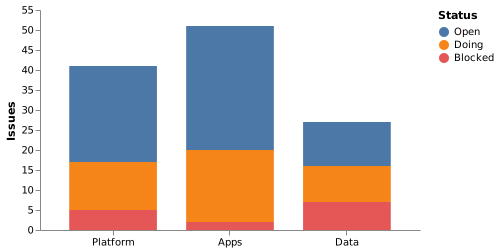
Stacking in Vega is a data transform rather than a mark option, which is the clearest illustration of how the grammar works.
Open it, edit it, or copy the source below.
{
  "$schema": "https://vega.github.io/schema/vega/v5.json",
  "width": 380,
  "height": 220,
  "padding": 5,
  "data": [{
    "name": "table",
    "values": [
      {"team": "Platform", "status": "Open", "n": 24},
      {"team": "Platform", "status": "Doing", "n": 12},
      {"team": "Platform", "status": "Blocked", "n": 5},
      {"team": "Apps", "status": "Open", "n": 31},
      {"team": "Apps", "status": "Doing", "n": 18},
      {"team": "Apps", "status": "Blocked", "n": 2},
      {"team": "Data", "status": "Open", "n": 11},
      {"team": "Data", "status": "Doing", "n": 9},
      {"team": "Data", "status": "Blocked", "n": 7}
    ],
    "transform": [{"type": "stack", "groupby": ["team"], "field": "n", "sort": {"field": "status"}}]
  }],
  "scales": [
    {"name": "x", "type": "band", "domain": {"data": "table", "field": "team"}, "range": "width", "padding": 0.25},
    {"name": "y", "type": "linear", "domain": {"data": "table", "field": "y1"}, "range": "height", "nice": true},
    {"name": "color", "type": "ordinal", "domain": {"data": "table", "field": "status"}, "range": {"scheme": "tableau10"}}
  ],
  "axes": [
    {"orient": "bottom", "scale": "x"},
    {"orient": "left", "scale": "y", "title": "Issues"}
  ],
  "legends": [{"fill": "color", "title": "Status"}],
  "marks": [{
    "type": "rect",
    "from": {"data": "table"},
    "encode": {
      "enter": {
        "x": {"scale": "x", "field": "team"},
        "width": {"scale": "x", "band": 1},
        "y": {"scale": "y", "field": "y0"},
        "y2": {"scale": "y", "field": "y1"},
        "fill": {"scale": "color", "field": "status"}
      }
    }
  }]
}