
Deployment diagram (PlantUML)
A deployment diagram answers the question a component diagram cannot: where does this actually run, and how do the pieces reach each other?
#What this example shows
Nodes containing artefacts, with versions on the artefacts.
Protocols and ports on the communication paths.
Replication drawn explicitly between data stores.
#A worked example
Open it, edit it, or copy the source below.
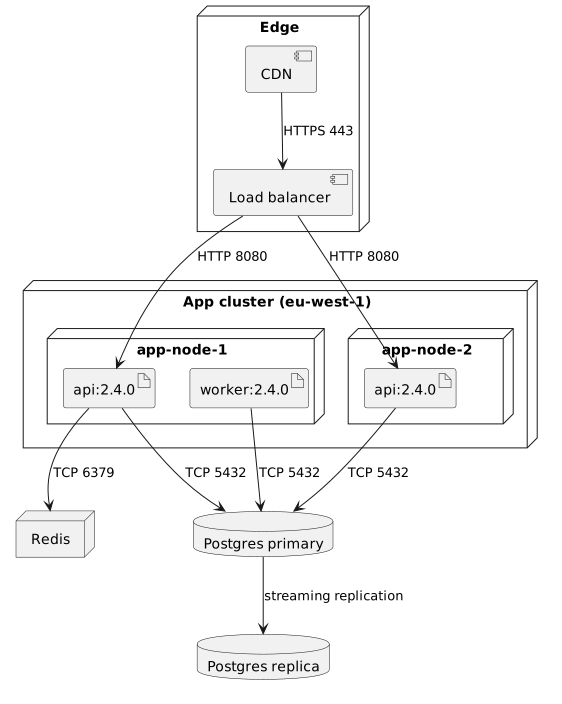
The source, which you can paste into a new diagram and edit:
#Making it your own
Put versions on artefacts, or the diagram describes an aspiration.
Label ports as well as protocols; firewall reviews need both.
One diagram per environment, or annotate the differences explicitly.
#Related
Verbose, stable, and it draws almost everything.























