
Git graph (Mermaid)
Most branching arguments are people picturing different diagrams. Drawing it takes a minute. This one shows a release branch, a tagged hotfix, and the merge back to main.
#What this example shows
branch and checkout, which move where the next commit lands.
Tags, which is usually the part people care about.
A merge back into main, drawn explicitly.
#A worked example
Open it, edit it, or copy the source below.
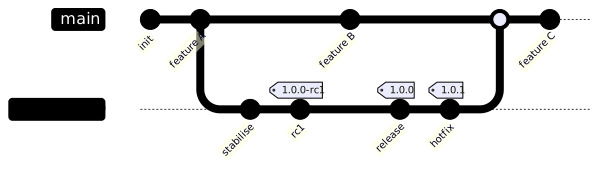
The source, which you can paste into a new diagram and edit:
#Making it your own
Draw what your team actually does, not what the process document says.
Keep it to about a dozen commits; it is an illustration, not a history.
Add a second branch to show a long-lived feature branch if that is the argument.
#Related
Copy it. Change one line. See what happens.























