
Gantt chart
Gantt charts get a bad reputation from being used as commitments rather than as plans. Used as a plan, they are good at one specific thing: showing which tasks cannot start until another finishes.
Mermaid has a Gantt syntax, so the chart lives in the page and changes in seconds.
#When to reach for one
Project plans with real dependencies rather than a wish list.
Migration and cutover planning, where sequence is everything.
Communicating a schedule to people who will not open a project tool.
#How to draw it in Capable
Route | Use when |
|---|---|
Mermaid | Text, so updating a date is a one-line change. |
draw.io | Presentation versions with custom styling. |
#A worked example
A migration plan with dependencies and a milestone:
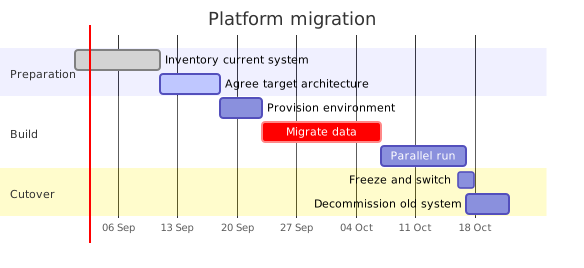
The source, which you can paste into a new diagram and edit:
#A few things that catch people out
Dependencies are the reason to draw one. A Gantt chart with no dependencies is a list with bars.
Mark the critical path; without it every bar looks equally important.
Keep it coarse. A Gantt chart with sixty rows is a project plan nobody reads.
#Related
A plan you can change is a plan people trust.























