
Timing diagram (PlantUML)
Timing diagrams show how long each state lasts, which no other UML diagram does. They are rare and exactly right when duration is the subject.
#What this example shows
robust and concise lifelines, which render differently on purpose.
Absolute times on the axis.
A duration constraint between two points.
#A worked example
Open it, edit it, or copy the source below.
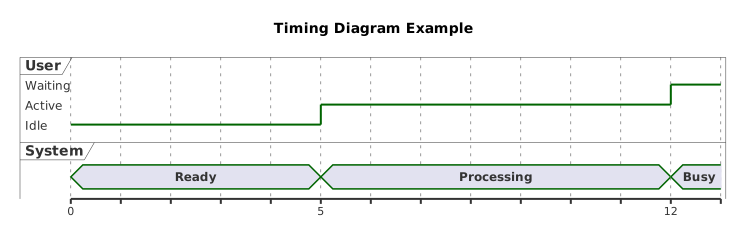
The source, which you can paste into a new diagram and edit:
#Making it your own
robust shows discrete named states; concise draws a compact single line. Mix them deliberately.
Put real units on the axis, or it is a state diagram drawn sideways.
The duration constraints are the reason to draw one. Annotate them.
#Related
Verbose, stable, and it draws almost everything.























