
Scientific diagrams with TikZ
TikZ is the LaTeX drawing language, and it is the right tool for figures that need to be exactly right: Feynman diagrams, quantum circuits, chemical structures, and mathematical figures.
It is verbose and precise, which is the trade you are making. Nothing else here produces publication-quality output from text.
#When to reach for one
Papers, theses and technical notes that will also exist as LaTeX.
Teaching material in physics, chemistry and mathematics.
Any figure where a hand-drawn approximation would be wrong.
#How to draw it in Capable
Route | Use when |
|---|---|
TikZ | Always, for scientific figures. The library ecosystem is the reason. |
draw.io | Only when the figure is illustrative rather than exact. |
#A worked example
A simple quantum circuit, drawn with TikZ:
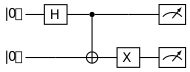
The source, which you can paste into a new diagram and edit:
#A few things that catch people out
TikZ rendering is heavier than the other languages; expect it to take longer.
TikZ is disabled by default and has to be enabled by an administrator. See Administration.
Use the right library: quantikz for circuits, tikz-feynman for Feynman diagrams, chemfig for molecules.
#Related
Approximately right is wrong here.























