
Bar chart (Vega-Lite)
This is the Vega bar chart written in Vega-Lite. Comparing the two is the fastest way to decide which you should be using, and the answer is usually this one.
#What this example shows
mark and encoding, which replace scales, axes and marks.
Sorting driven by the encoded value.
A rounded bar end, set on the mark.
#A worked example
Open it, edit it, or copy the source below.
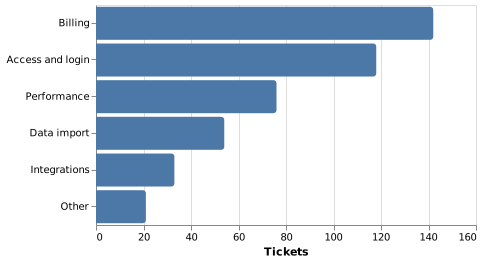
The source, which you can paste into a new diagram and edit:
#Making it your own
sort: "-x" ranks the bars by value, which is almost always what you want.
Horizontal bars handle long category names; vertical bars do not.
Set title to null to remove an axis title that adds nothing.
#Related
A real chart in about ten lines.























