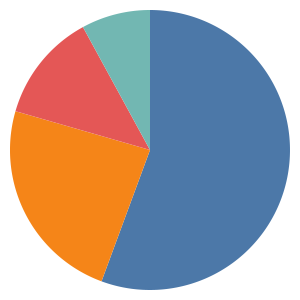
Pie chart (Vega)
Vega builds a pie chart from a pie transform, which computes the start and end angle for each row, and an arc mark that draws them.
#What this example shows
A pie transform producing startAngle and endAngle.
An arc mark with inner and outer radius.
A signal, so the radius is declared once.
#A worked example
Open it, edit it, or copy the source below.
The source, which you can paste into a new diagram and edit:
{
  "$schema": "https://vega.github.io/schema/vega/v5.json",
  "width": 300,
  "height": 300,
  "autosize": "none",
  "signals": [{"name": "radius", "update": "width / 2 - 10"}],
  "data": [{
    "name": "table",
    "values": [
      {"part": "Test suite", "seconds": 420},
      {"part": "Build", "seconds": 180},
      {"part": "Deploy", "seconds": 95},
      {"part": "Smoke tests", "seconds": 60}
    ],
    "transform": [{"type": "pie", "field": "seconds"}]
  }],
  "scales": [{
    "name": "color", "type": "ordinal",
    "domain": {"data": "table", "field": "part"},
    "range": {"scheme": "tableau10"}
  }],
  "legends": [{"fill": "color", "title": "Stage"}],
  "marks": [{
    "type": "arc",
    "from": {"data": "table"},
    "encode": {
      "enter": {
        "x": {"signal": "width / 2"},
        "y": {"signal": "height / 2"},
        "startAngle": {"field": "startAngle"},
        "endAngle": {"field": "endAngle"},
        "outerRadius": {"signal": "radius"},
        "innerRadius": {"value": 0},
        "fill": {"scale": "color", "field": "part"}
      }
    }
  }]
}
#Making it your own
Set innerRadius above zero and it becomes a donut.
autosize: none is needed because the marks are positioned by signal.
Four slices is about the limit. Beyond that, a sorted bar chart is clearer.
All the control, all the ceremony.