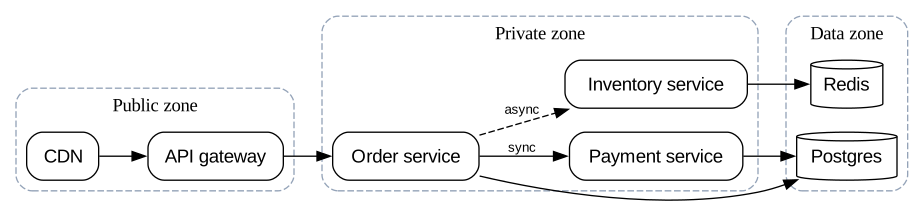
Subgraph and cluster (GraphViz)
A subgraph whose name begins with cluster_ is drawn as a labelled box. That is the mechanism for showing boundaries in Graphviz.
#What this example shows
cluster_ prefixed subgraphs, which draw a boundary.
Per-cluster styling.
Edges crossing cluster boundaries, which is usually the interesting part.
#A worked example
Open it, edit it, or copy the source below.
The source, which you can paste into a new diagram and edit:
digraph services {
  rankdir=LR;
  compound=true;
  node [shape=box, style=rounded, fontname="Helvetica"];
  edge [fontname="Helvetica", fontsize=10];

  subgraph cluster_public {
    label="Public zone";
    style="rounded,dashed";
    color="#94a3b8";
    gateway [label="API gateway"];
    cdn [label="CDN"];
  }

  subgraph cluster_private {
    label="Private zone";
    style="rounded,dashed";
    color="#94a3b8";
    orders [label="Order service"];
    payments [label="Payment service"];
    inventory [label="Inventory service"];
  }

  subgraph cluster_data {
    label="Data zone";
    style="rounded,dashed";
    color="#94a3b8";
    pg [label="Postgres", shape=cylinder];
    redis [label="Redis", shape=cylinder];
  }

  cdn -> gateway;
  gateway -> orders;
  orders -> payments [label="sync"];
  orders -> inventory [label="async", style=dashed];
  orders -> pg;
  payments -> pg;
  inventory -> redis;
}
#Making it your own
The cluster_ prefix is required. A subgraph without it draws no box.
compound=true lets you draw edges to a cluster rather than to a node inside it.
Style the clusters consistently, or the boundaries stop reading as boundaries.
Give it the edges. It does the rest.