
Git branching diagram
Every team argues about branching, and most of the argument is people picturing different diagrams. Drawing it settles the question in about a minute.
Mermaid has a dedicated git graph syntax, so the diagram is a few lines and stays accurate.
#When to reach for one
Documenting your branching model for new joiners.
Explaining a release process involving cherry-picks and hotfixes.
Comparing trunk-based development with a longer-lived branch model.
#How to draw it in Capable
Route | Use when |
|---|---|
Mermaid | Purpose-built syntax; the obvious choice. |
draw.io | Teaching diagrams where you want annotation and emphasis. |
#A worked example
A release branch with a hotfix merged back:
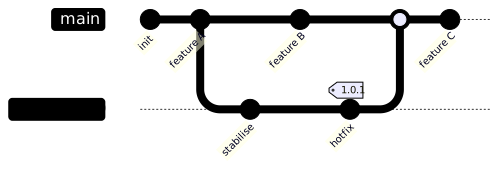
The source, which you can paste into a new diagram and edit:
#A few things that catch people out
Draw what you actually do, not what the process document says.
Tag releases in the diagram; that is usually the part people care about.
Keep it to about a dozen commits. It is an illustration, not a history.
#Related
Cheap to change means it stays true.























