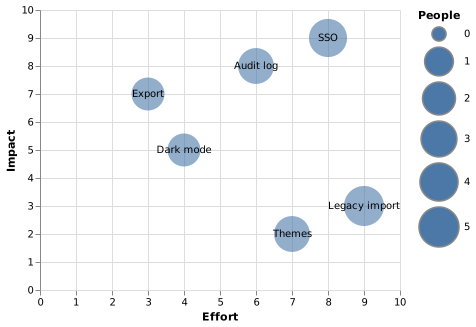
A bubble chart is a scatter plot with a size channel. The important detail is that size in Vega is area, which is the perceptually correct choice.
Open it, edit it, or copy the source below.
{
  "$schema": "https://vega.github.io/schema/vega/v5.json",
  "width": 360,
  "height": 280,
  "padding": 5,
  "data": [{
    "name": "items",
    "values": [
      {"item": "SSO", "effort": 8, "impact": 9, "people": 4},
      {"item": "Export", "effort": 3, "impact": 7, "people": 2},
      {"item": "Audit log", "effort": 6, "impact": 8, "people": 3},
      {"item": "Dark mode", "effort": 4, "impact": 5, "people": 2},
      {"item": "Themes", "effort": 7, "impact": 2, "people": 3},
      {"item": "Legacy import", "effort": 9, "impact": 3, "people": 5}
    ]
  }],
  "scales": [
    {"name": "x", "type": "linear", "domain": [0, 10], "range": "width"},
    {"name": "y", "type": "linear", "domain": [0, 10], "range": "height"},
    {"name": "size", "type": "sqrt", "domain": {"data": "items", "field": "people"}, "range": [200, 1600]}
  ],
  "axes": [
    {"orient": "bottom", "scale": "x", "title": "Effort", "grid": true},
    {"orient": "left", "scale": "y", "title": "Impact", "grid": true}
  ],
  "legends": [{"size": "size", "title": "People", "symbolFillColor": "#4c78a8"}],
  "marks": [
    {
      "type": "symbol",
      "from": {"data": "items"},
      "encode": {"enter": {
        "x": {"scale": "x", "field": "effort"},
        "y": {"scale": "y", "field": "impact"},
        "size": {"scale": "size", "field": "people"},
        "fill": {"value": "#4c78a8"},
        "fillOpacity": {"value": 0.6}
      }}
    },
    {
      "type": "text",
      "from": {"data": "items"},
      "encode": {"enter": {
        "x": {"scale": "x", "field": "effort"},
        "y": {"scale": "y", "field": "impact"},
        "text": {"field": "item"},
        "align": {"value": "center"},
        "baseline": {"value": "middle"},
        "fontSize": {"value": 10}
      }}
    }
  ]
}