
Vega
Vega is a visualization grammar rather than a chart library: you describe scales, marks and encodings, and it draws whatever you specified.
Reach for it when Vega-Lite cannot express what you need. For ordinary charts, Vega-Lite is a fraction of the work.
#What it is good at
Custom visualizations with no standard chart equivalent.
Layered or composite charts needing precise control.
Anything where the default chart types genuinely do not fit.
#What it draws
Diagram | Syntax starts with |
|---|---|
Data | "data": [{"name": "table", "values": [...]}] |
Scales | "scales": [{"name": "x", "type": "band", ...}] |
Axes | "axes": [{"orient": "bottom", "scale": "x"}] |
Marks | "marks": [{"type": "rect", "encode": {...}}] |
#A worked example
A bar chart written out in full Vega, scales and all:
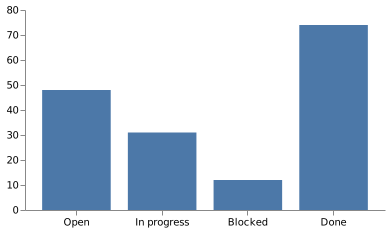
The source, which you can paste into a new diagram and edit:
#A few things that catch people out
The $schema URL is how Vega and Vega-Lite are told apart. Keep it.
Data is embedded in the spec, so the chart is a snapshot. Date it.
Interactive signals do not survive as a static rendering.
#Related
Learn one properly. Borrow the rest when you need them.






















