
GraphViz
Graphviz takes a description of nodes and edges in DOT and works out the layout itself. That makes it the right choice when the graph is generated, large, or changes shape as it grows.
It is also the format most tooling already emits, so importing a generated graph usually means pasting it in.
#What it is good at
Generated graphs: dependencies, call graphs, lineage.
Large graphs where hand layout is impractical.
Any diagram where you care about the connections and not the positions.
#What it draws
Diagram | Syntax starts with |
|---|---|
Directed graph | digraph name { a -> b; } |
Undirected graph | graph name { a -- b; } |
Layout engines | dot, neato, fdp, circo, twopi, set with layout= |
Clusters | subgraph cluster_x { ... } to draw a box around a group |
#A worked example
Clusters, an engine choice, and styled edges:
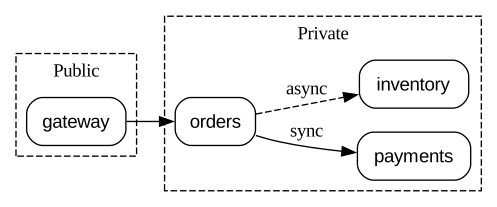
The source, which you can paste into a new diagram and edit:
#A few things that catch people out
digraph or a braced graph name { } is what identifies DOT. A bare graph TD is Mermaid.
The layout engine matters: circo suits rings, neato suits meshes, dot suits hierarchies.
Very large graphs hit rendering limits. Filter the graph before pasting it.
#Related
Learn one properly. Borrow the rest when you need them.























