
Dashboard total looks inflated, or Stale content dwarfs every other rule on a site that is only part
What you are seeing
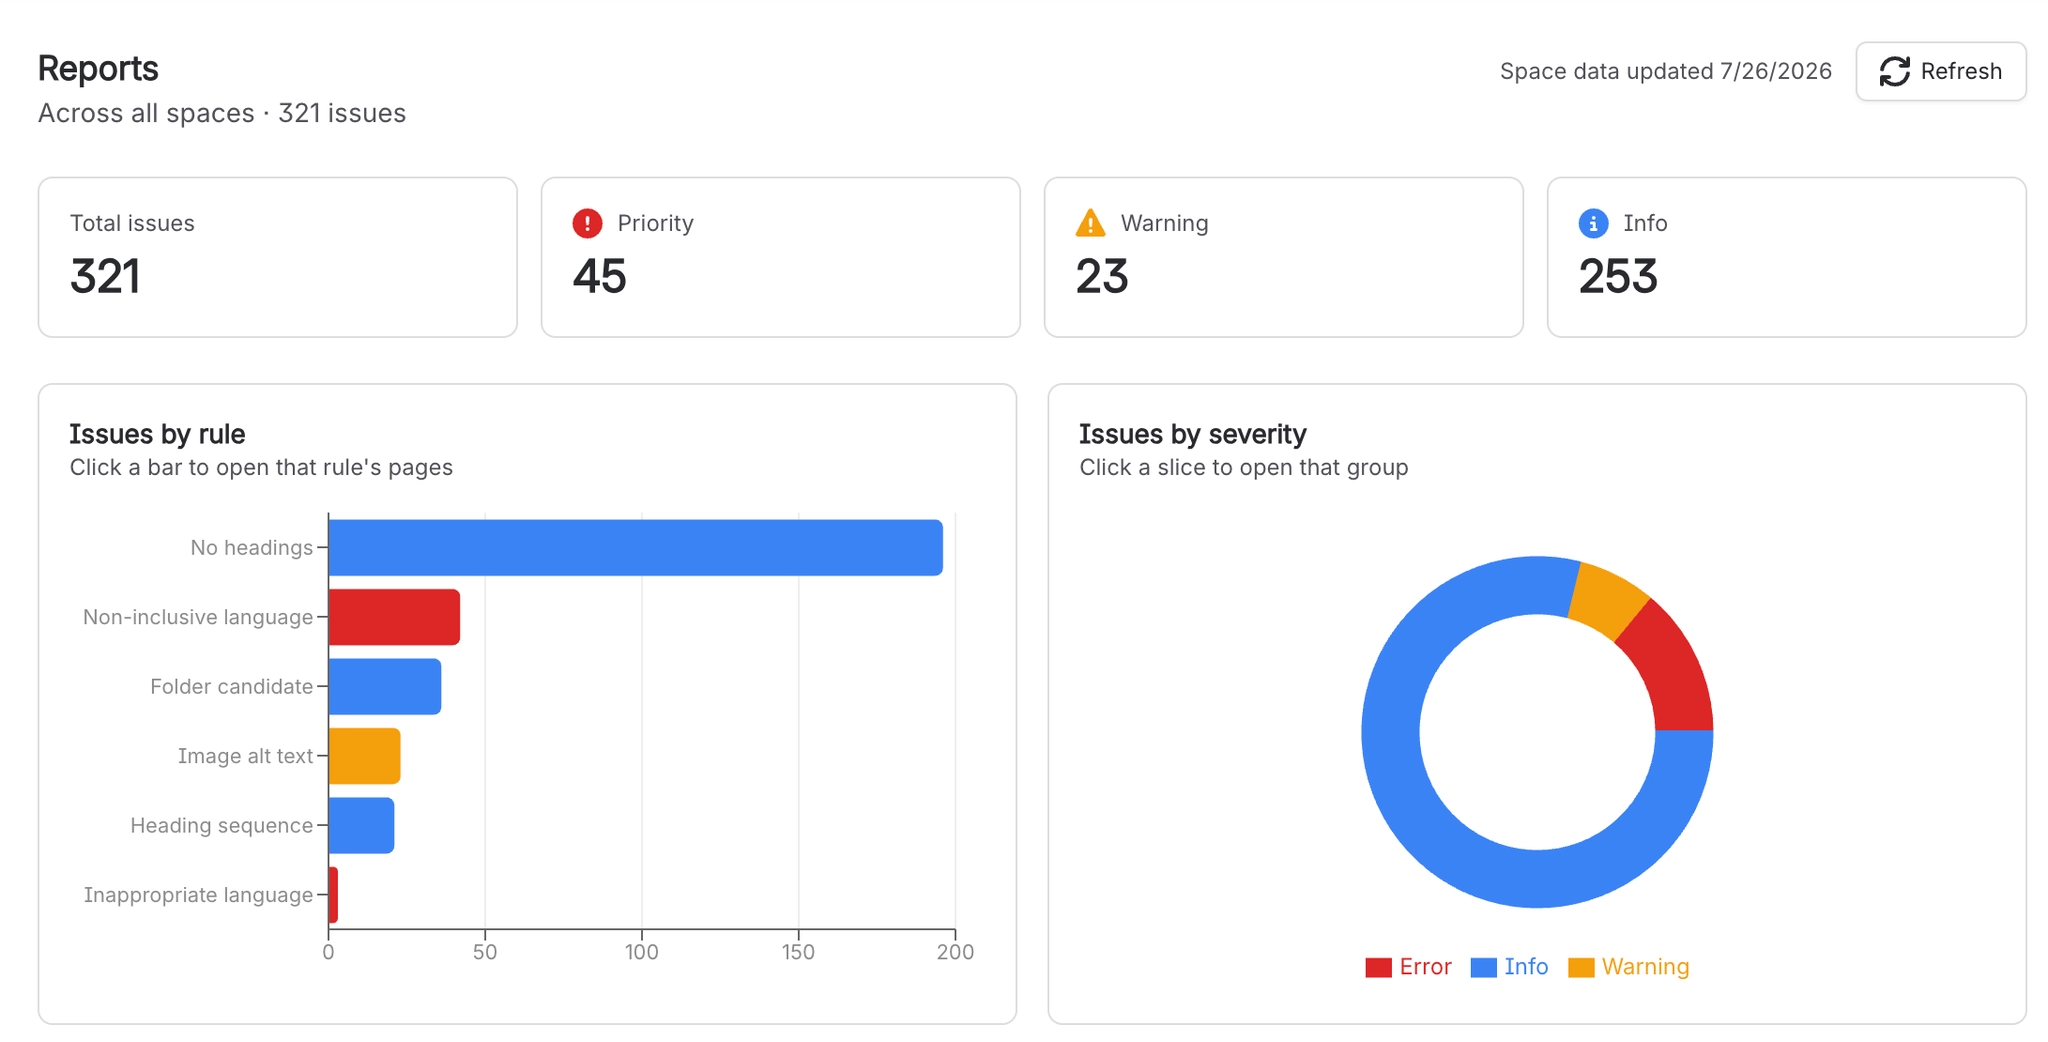
The Dashboard total looks inflated, or Stale content dwarfs every other rule on a site that is only partly indexed.
#Why it happens
Five rules. Disallowed domain links, Disallowed macros, Third-party macros, Stale content and Disallowed labels. Are worked out live and do not require the page to be indexed, so they count pages the eight indexed rules cannot see. On a half-indexed site the total mixes full-coverage and partial-coverage numbers.
#What to do
Treat the total as provisional until indexing coverage reaches 100%. Compare per-rule numbers rather than the headline total while the amber banner is showing.
#Settings involved
Setting | Where | What it does |
|---|---|---|
Rule level (per rule) | Capable Quality → Manage → Rules | - |
Blocked domains list (Disallowed domain | Rules → Disallowed domain links | - |
Refresh (Dashboard) | Capable Quality → Dashboard → Refresh | - |
#Limits that apply here
Limit | Value | What happens |
|---|---|---|
Indexing coverage banner threshold | Below 95% coverage the Dashboard shows a | - |
Live count cache | 30 seconds | - |
#Related
On a space-scoped Quality page the header says "Space: <name>" but "Issues over time" shows site-wid
The trend series is not space-scoped. ("Top spaces by issues" is correctly hidden in space
One-click fix removed words from a page and there is no undo inside Quality
The inappropriate-language fix deletes matched words rather than masking them, and both la
Export and published sites
The rest of this family.
Found it? Good.























